What they show and how to read them correctly
Below you’ll find a breakdown of race statistics compiled over a large population of races. These figures are published to provide transparency and help explain how the ratings on this website have performed over time.
The statistics on this page are historical. They are shared to give context around consistency, strike rate and variability, not to suggest future results or guaranteed outcomes.
If you are not already familiar with how the ratings themselves work, we recommend reading how to use the ratings first. This page is designed to support that guide by explaining how the underlying statistics should be interpreted.
Why these statistics were compiled
These statistics were compiled independently by a long-term user of the website who has spent a significant amount of time recording and reviewing results across thousands of races. They are published here with permission to help answer common questions about strike rate, consistency and long-term performance.
We do not maintain a daily cumulative results tally ourselves. Instead, this data provides a broader view of performance across extended periods rather than short-term runs, which can be misleading.
If you have questions about how the figures were compiled, you’re welcome to contact us and we can pass on further details.
How the pot percentage is calculated
Questions often come up about how the pot (return on investment) figures are calculated, so it’s important to explain the method clearly.
The approach used was:
- Only first rated horses that actually ran were included (net of barrier scratchings)
- No substitutions were made using second rated selections
- Winning payouts were recorded using official NSW TAB win dividends
- Results were calculated on a course-by-course basis
- The pot represents total winnings divided by the number of first rated runners that started
NSW TAB prices were used purely for consistency and availability of data.
Consistency and expectations
Consistency is an important consideration when using any ratings-based approach.
Historically, the top two rated selections have shown an average strike rate of around 50% across all races. This is an overall measure across a large sample, not a daily or weekly expectation.
Results will vary. Losing runs are inevitable. This is why:
- Bank management matters
- Selectivity matters
- Short-term results should not be over-analysed
These principles are explained in more detail in how to use the ratings and are essential to understand before placing bets.
A sensible betting approach
A disciplined approach used by many experienced punters typically includes:
- Betting a fixed percentage of a betting bank
- Focusing on the top rated selections only
- Setting realistic goals
- Stepping away once those goals are reached
Reviewing early bookmaker prices can also be useful. Early markets often reflect value more accurately before prices adjust later in the day. Races dominated by very short-priced favourites may offer limited value and can be ignored.
Ratings are most effective when combined with price awareness and selectivity, not volume.
A note on betting every race
If your approach is to bet on every race, this website may not be suitable for you.
The percentages shown here are overall measures of historical consistency. They do not remove risk and they do not account for individual betting behaviour. Without discipline, money management and patience, results can deteriorate quickly.
The aim is not short-term wins, but controlled decision-making over time.
Explanation of the statistics below
The data on this page is grouped into four sections. Each highlights a different aspect of performance. The sections below include historical performance snapshots to support the explanations above.
Overall results across the full race sample
This grouping looks at 13,534 races over a defined period and shows:
- Strike rate
- Pot results
- Performance across rated runners
- Results net of barrier scratchings
This provides a high-level reference point for how the ratings have performed historically when applied without additional filtering.
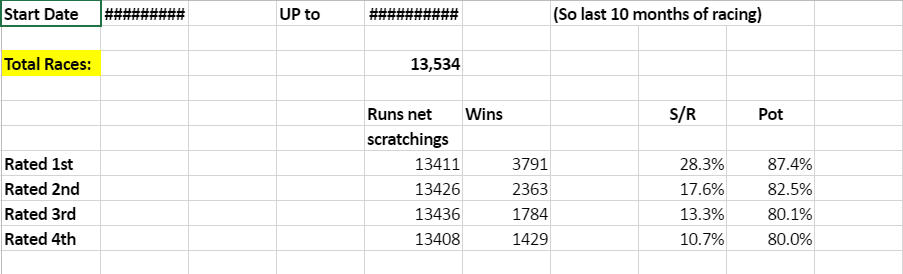
Historical performance snapshot showing strike rate and pot results across 13,534 races. Results reflect past outcomes only and are provided for explanatory purposes.
The effect of odds on performance
This section shows how NSW TAB odds for the first rated horse influence results.
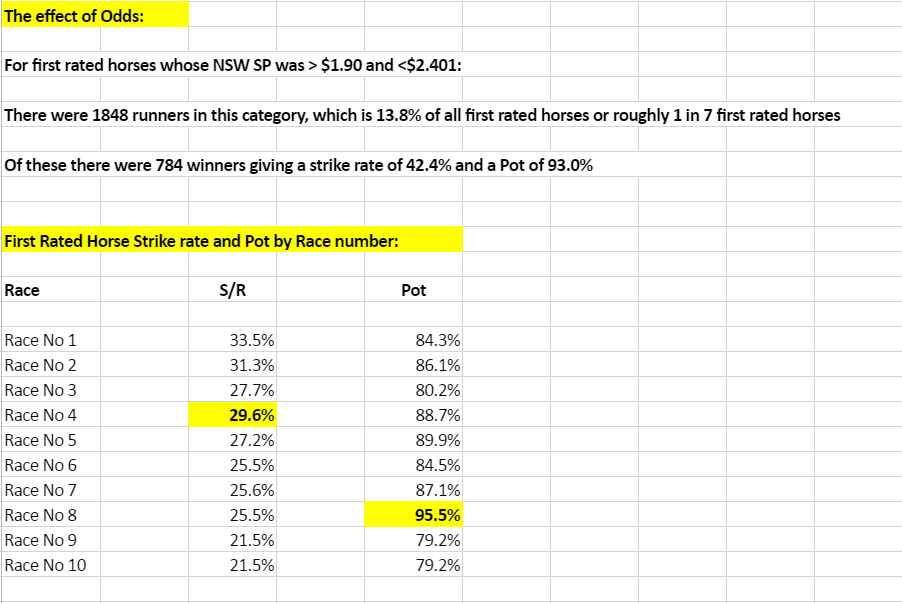
Historical breakdown of first rated horse performance by NSW TAB odds range. This data illustrates how strike rate and returns have varied across different price points.
It helps illustrate:
- Where strike rates tend to be higher
- Where returns may weaken or improve
- Why odds context is critical when interpreting results
Odds should always be considered alongside ratings, not in isolation.
Consistency measured every 500 races
Performance is also broken into blocks of 500 races to help show how results behave over time.
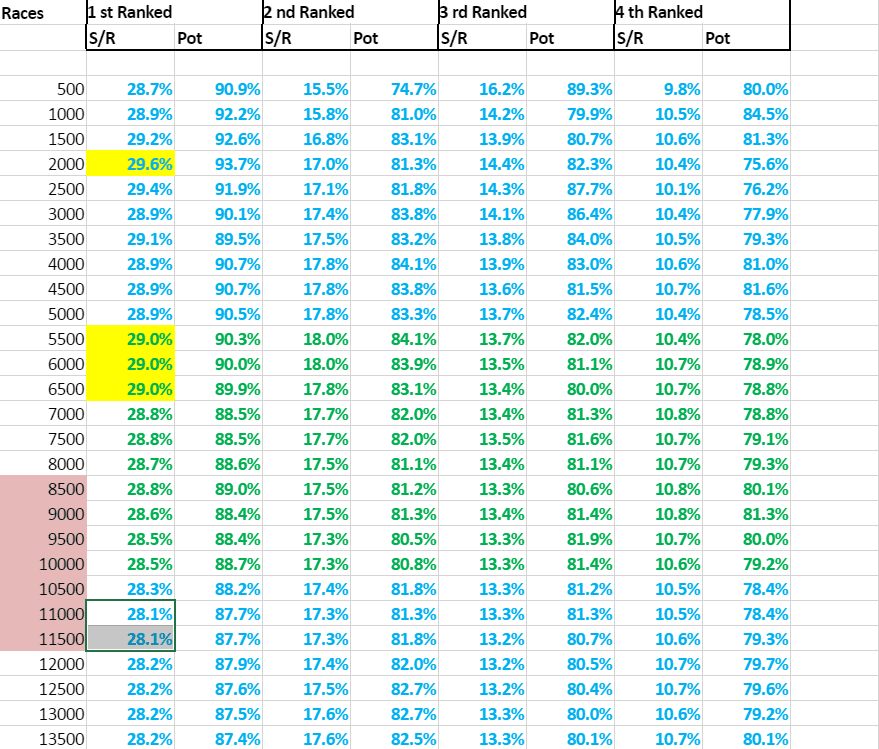
Performance results grouped into consecutive 500-race blocks to illustrate how strike rate and pot have fluctuated over time.
This demonstrates:
- Normal fluctuations in strike rate and returns
- Why short-term runs can be misleading
- The importance of judging performance over meaningful samples
First rated horse strike rate over 100-race intervals
The final grouping breaks results into 100-race intervals across a defined period.
This highlights:
- Short-term variability
- The reality of losing runs
- Why emotional reactions to recent results can be harmful
These figures are included to set realistic expectations, not to encourage short-term betting decisions.
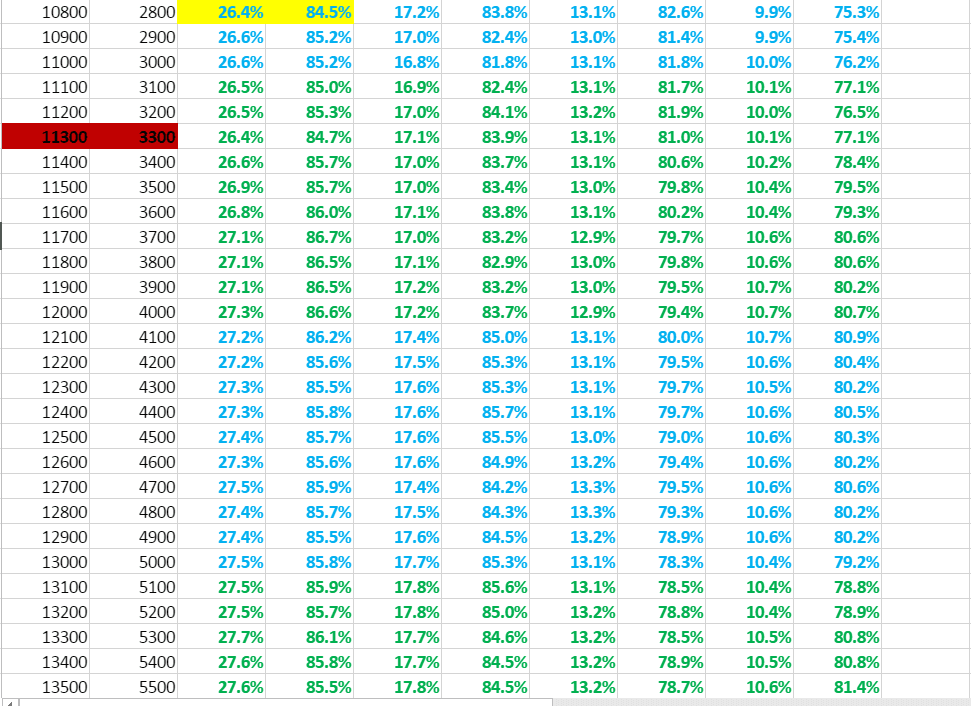
Short-term performance snapshot showing first rated horse strike rate and pot over consecutive 100-race intervals. Included to demonstrate natural variability.
How to use this page properly
This page should be used as a reference, not as a tipping tool.
It works best when read alongside how to use the ratings, so you understand:
- What the ratings are designed to do
- How historical performance behaves
- Why discipline and selectivity matter
You can view how the ratings are applied each day in our free horse racing tips and daily results sections.
Final notes on transparency
Horse racing always involves uncertainty. These statistics are published to show performance honestly, without removing difficult periods or smoothing results.
Ratings provide structure. Statistics provide context. Sound decisions come from understanding both.
Best regards,
Mike Keenan, Bill MacDonald and the team at Horse Racing Tips Australia